
Splitting Functions
The splitting of Earth’s free oscillation spectra places important constraints on compressional and shear wave velocity, and potentially, the density structure of the Earth’s mantle. Splitting functions are measured from normal mode spectra and used in tomographic modelling, often in combination with shorter period data. Despite these efforts, many fundamental questions regarding the Earth’s long period structure remain unanswered.
Several large events have occurred in recent years, giving us the opportunity to significantly increase the splitting function data set compared to earlier studies. My new data set contains modal spectra up to 10 mHz for all Mw > 7.5 events from the last 35 years (1976-2010). It includes the Sumatra events of 2004 (Mw=9.0) and 2005 (Mw=8.6), the 2008 Wenchuan, China event (Mw=7.9) and the 2010 Chile event (Mw=8.8). The new events provide significant increase of data coverage in previously unsampled regions. For example, the new data allowed us to make robust measurements of splitting functions for some of the longest period normal modes, including 0S2, 0S3 and 1S2. Including cross-coupling (or resonance) between different oscillations, we have been able to measure hemispherical variations in inner core anisotropy for the first time, and also made observations of the elusive core-mantle boundary Stoneley modes.
Whenever you use the dataset, please acknowledge:
Deuss, A., Ritsema, J., and H. J. van Heijst (2013). A new catalogue of normal-mode splitting function measurements up to 10 mHz, Geophysical Journal International 193 (2), p.920-937
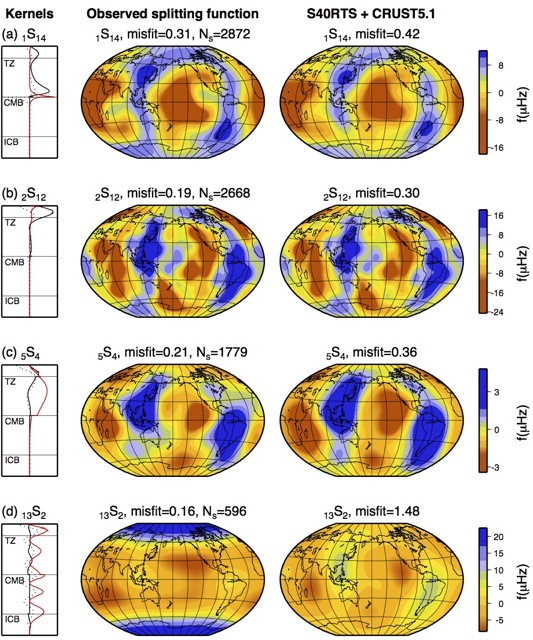
Observed splitting function maps and predictions for mantle model S20RTS, from Deuss et al (2013). N_s gives the total number of spectra used for the splitting function measurement. The misfit is calculated between the observed spectra and theoretical spectra and is found to be much smaller using the observed splitting functions instead of the predictions for the S40RTS mantle shear wave velocity model (Ritsema et al, 2011) and crustal model CRUST5.1.The left panels show the sensitive kernels for each mode, where red is v_p, solid black is v_s and dashed is density.
Publications
- Mäkinen, A. M. and Deuss, A. (2013). Normal mode splitting due to inner core attenuation anisotropy, Geophysical Journal International 195(3) , p1786–1795
- Koelemeijer, P., Deuss, A., and Ritsema, J. (2013). Observations of core-mantle boundary Stoneley modes, Geophysical Research Letters 40(11) , p2557–2561
- Deuss, A., Ritsema, J., and Van Heijst, H. (2013). A new catalogue of normal-mode splitting function measurements up to 10 mHz, Geophysical Journal International 193(2) , p920–937
- Deuss, A., Ritsema, J., and Heijst, H. v. (2011). Splitting function measurements for Earth’s longest period normal modes using recent large earthquakes, Geophysical Research Letters 38(4), L04303
- Deuss, A., Irving, J. C. E., and Woodhouse, J. H. (2010). Regional Variation of Inner Core Anisotropy from Seismic Normal Mode Observations, Science 328(5981) , p1018–1020